When we began expanding the datasets available on viaNexus, adding fundamentals was an obvious step. Financial statements are the backbone of company and equity research - driving insights from valuation, performance analysis, and peer comparison across industries.
At viaNexus, we already distribute as-reported fundamentals and filings, drawn directly from the 10-Q and 10-K filings submitted by public companies. That data is faithful to the source and valuable for traceability. But it is not sufficient for serious analysis.
As-reported data reflects the inconsistencies of the filings themselves. Companies use different labels, structures, and interpretations for the same accounting concepts. The result is a dataset that mirrors filings accurately—but becomes difficult to compare across companies or across time.
That works for inspection. It breaks down for analysis. Anyone building valuation models, financial dashboards, or AI-driven research workflows quickly encounters the same issue: raw filings are not analytically consistent. If fundamentals were going to be added to viaNexus properly, they would need to be normalized, structured, and delivered in a form that analytical systems—and increasingly AI systems—can rely on.
Doing that properly is far from trivial.
Rather than take shortcuts, we partnered with SavaNet, combining their deep domain expertise in financial reporting with the viaNexus platform for normalization, API delivery, and agent-ready infrastructure.
This approach reflects a broader philosophy. When complex datasets require deep subject-matter expertise, we believe the best solution is to combine domain specialists with modern data infrastructure. You should expect to see more datasets built this way on viaNexus going forward.
From As-Reported to Analyzable
The distinction between as-reported and normalized data matters.
As-reported fundamentals tell you what a company filed, according to its interpretation of accounting standards, its industry context, and sometimes its narrative choices.
Normalized fundamentals translate those filings into a consistent analytical framework.
Serious financial analysis requires:
- A standard financial statement schema
- Consistent definitions across companies and time
- Stable line items that behave predictably
Only once financial statements are normalized into a coherent structure can you reliably:
- Perform statement-level analysis
- Compare operating performance across peers
- Calculate accounting ratios
- Derive valuation metrics
Normalization isn’t a convenience. It is the foundation that makes analysis possible.
The Illusion of “Standard” XBRL
We began by examining the obvious starting point: U.S. filings.
In theory, XBRL provides a standardized language for financial reporting. In practice, it behaves more like a flexible taxonomy framework than a true standard.
Across U.S. filings, there are more than 10,000 XBRL tags currently in use. Companies frequently describe the same economic concept using different tags, structures, or contextual assumptions.
Consider the first line of the income statement:
- us-gaap:RevenueFromContractWithCustomerExcludingAssessedTax (most common)
- us-gaap:SalesRevenueNet (Common for manufacturers or retailers)
- us-gaap:RevenuesNetOfInterestExpense (Used by financial institutions or special structures)
- us-gaap:InterestIncome (Banks often treat interest income as revenue)
- us-gaap:OperatingRevenue (Sometimes used for regulated industries or utilities)
But some companies use custom extensions - that fits their statement wording - eg:
- aapl:NetSales
- tsla:AutomotiveSalesRevenue
These may represent the same economic concept—or slightly different ones—depending on the filer. Multiply that ambiguity across balance sheets, cash flow statements, industry-specific disclosures, and footnotes, and the problem becomes clear:
XBRL does not produce comparable fundamentals out of the box.
For most analytical use cases, the raw output is simply not usable.
There Is No Shortcut Around the Hard Work
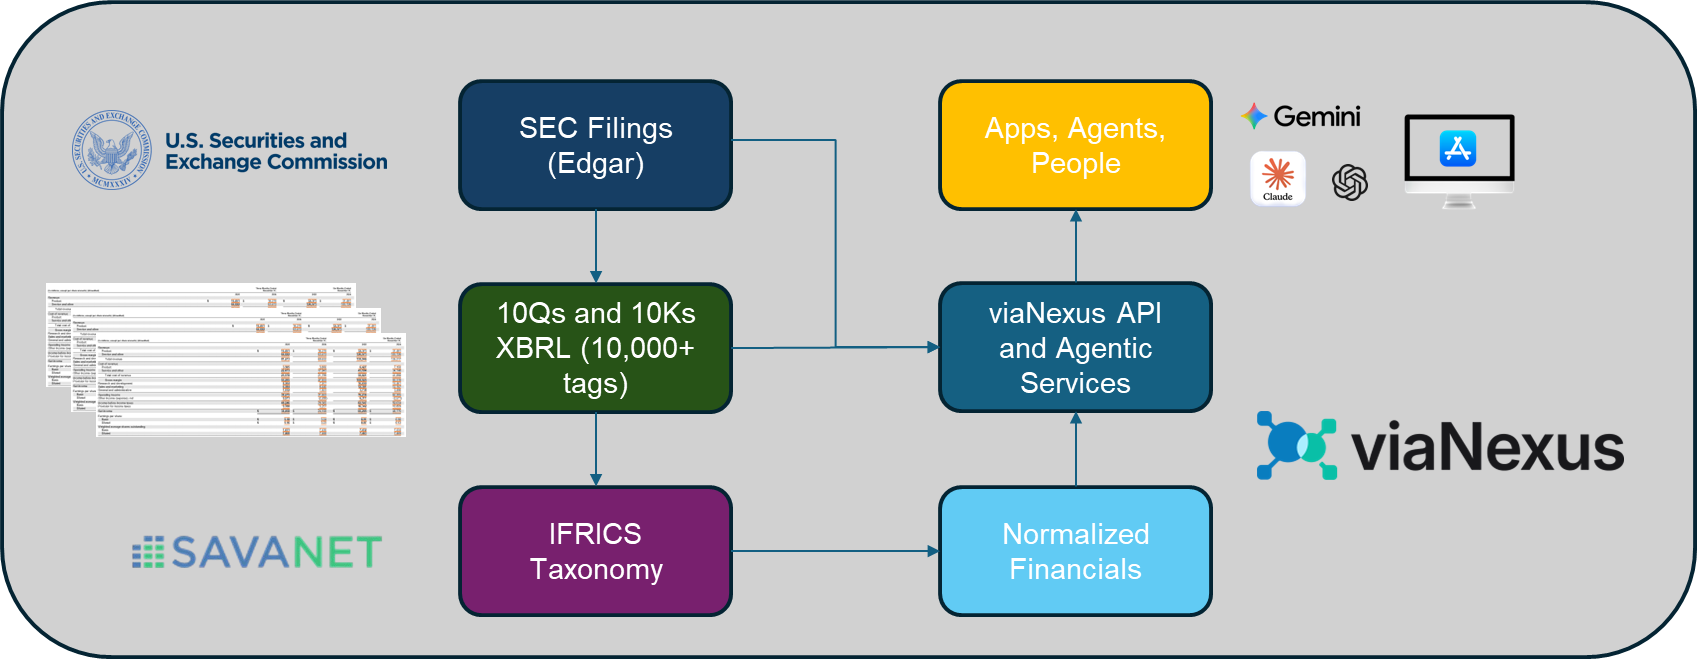
SavaNet’s founder, Eric Linder CFA, has worked with regulatory filings and institutional financial data for decades. Early in the evolution of XBRL, he developed IFRICS, a purpose-built financial taxonomy designed to impose consistent structure on real-world filings.
IFRICS is a five-level hierarchy that maps filings into a standardized financial statement framework.
Rather than simply mapping tags, the framework:
- Resolves semantic ambiguity
- Separates economic meaning from filing convention
- Preserves industry nuance while enforcing consistency
Every reported XBRL item is mapped into this hierarchy through a deterministic process. Edge cases are explicitly handled, and granularity is preserved rather than flattened prematurely.
In many competing datasets, a significant number of items ultimately end up grouped into generic “Other” categories due to insufficient taxonomy depth. The IFRICS approach avoids that outcome by maintaining detailed structural mappings across the hierarchy.
To validate the framework, we tested it rigorously across the Russell 1000, iterating through thousands of disclosures until the dataset formed a consistent and internally coherent structure.
It is meticulous work—but it is the only reliable way to build a truly analyzable fundamentals dataset.
Once the framework is established, however, the methodology scales efficiently across the broader equity universe.
Deterministic by Design
One point is worth emphasizing. The normalization process does not rely on large language models or manual interpretation.
LLMs are probabilistic by nature. Human interpretation introduces judgment drift over time. Neither approach is well suited for producing datasets that must remain consistent across decades of filings, thousands of companies, and repeated reporting cycles.
Instead, the process is:
- Rule-driven
- Taxonomy-based
- Deterministic and repeatable
Once a filing element is mapped into the schema, it will map the same way tomorrow, next quarter, and five years from now. This way consistency is not an emergent property, it is designed into the system.
Why the Schema Matters
The real innovation in the dataset is not just normalization—it is schema design.
The IFRICS taxonomy is deliberately deep, with five levels of abstraction:
- Levels 1–2: Universally comparable financial concepts
- Levels 3–4: Industry-aware financial structure
- Level 5: Filing-level granularity and edge-case detail
This structure allows financial data to be rolled up into consistent, comparable metrics—or drilled into at a very granular level when needed.
Through the viaNexus API, we expose the first two levels of the hierarchy to provide a clean analytical interface. Behind the scenes, the deeper layers preserve the detailed mappings required to maintain structural integrity.
For clients that need full transparency, the deeper mappings can also be made available.
Clean Inputs Create Deterministic Outcomes
Many downstream analytical errors originate upstream in the data.
By resolving ambiguity once—deterministically and at scale—we reduce:
- Reconciliation work for analysts
- Semantic confusion for AI models
- Inconsistent outputs across time and universe
Better inputs lead to more reliable outputs.
This principle becomes even more important as financial workflows increasingly incorporate AI-driven analysis.
Why This Matters for Agentic Workflows
viaNexus is designed to support agentic financial workflows through the vAST services layer.
Agent-driven systems depend on predictable inputs. Ambiguity compounds quickly. Inconsistent datasets lead to inconsistent outputs.
By eliminating ambiguity at the data layer, we give both humans and AI systems a stable analytical foundation.
The reliability of AI systems does not improve simply because the models improve. It improves because the data feeding those systems becomes cleaner, more structured, and more deterministic.
Try It Yourself
You can explore the dataset directly through a free viaNexus account - or dive straight in with a paid tier - tailored for individuals and enterprises.
Sign up at viaNexus.com and browse the catalog.
The dataset currently includes:
- Coverage of more than 3,000 U.S. companies
- More than 250 fields spanning income statement, balance sheet, and cash-flow metrics, along with derived valuation and accounting ratios
- Industrials, banks, and insurance companies (each with their own schemas)
- Five years of financial history, with deeper historical coverage planned
Full documentation is available in the viaNexus API console and here:
https://console.blueskyapi.com/docs/EDGE/fundamentals/NORMALIZED_FUNDAMENTALS
Fundamentals, Rebuilt as Infrastructure
As-reported fundamentals are useful.
Normalized fundamentals are essential.
This dataset was not designed to sit inside a spreadsheet. It was built as financial data infrastructure—for analysis, valuation, and intelligent systems that require clean, deterministic inputs.
With the right partners and a willingness to do the hard work, what once seemed complex becomes scalable.
And this is just the beginning. Expect more datasets on viaNexus built using the same model: deep domain expertise paired with modern normalization and delivery infrastructure.
Because the future of financial data is not simply more data, it is better-structured data, delivered as infrastructure.